vCHS Monitoring and Capacity Management 101 – the Practice
In the previous blog post I provided a high level (101) theoretical overview of how resource monitoring and capacity management work in vCHS. Particularly how VPCs on shared clouds and vDCs on dedicated clouds differ from each others. Please read it for proper context.
That was the theory. This blog post is about practicing the theory.
The Need
There I argued about what information I'd need to know do proper resource monitoring and capacity planning for a bus (the bus was the analogy I used). I will now try to borrow from that argument.
Here I will argue (with examples) what information a vCHS consumer would need to know to do proper resource monitoring and capacity planning for a vCHS virtual data center:
1- You want to know how big the virtual data center is. That will determine, in the end, how many VMs you can instantiate (regardless of whether or not you want to reserve capacity for those). You can fit more VMs in a virtual data center with 10GB of memory than you could in a virtual data center with 5GB of memory
2- In case you are reserving capacity (either explicitly on VMs in vDCs or implicitly on virtual data centers in VPCs) you want to know how many VMs you can still instantiate and power on before the system refuses to do so. The size of reservations can never go beyond the allocated size of a virtual data center, regardless of the actual usage of those VMs
3- You want to know both how each single VM but more importantly how all VMs collectively are behaving. Regardless of whether you reserved capacity or not, the more resources they demand, the less resources will be available to other VMs. The behavior of individual VMs (and collectively all VMs) in a virtual data center may determine how many VMs you can instantiate without too much noisy neighborhood effect inside your sandbox. That noise could compromise your application SLAs (that are different from the vCHS SLAs).
The Problem
Having this level of information has always been a challenge in a vCloud Director environment. For the following reasons:
A - You don't have visibility into VM level actual usage
B - You don't have visibility into virtual data center level actual usage (i.e. how much, collectively, all VMs are consuming)
C - You have visibility into VM level and virtual data center level reservations but you don't have historic view of those values.
The Path to the Solution
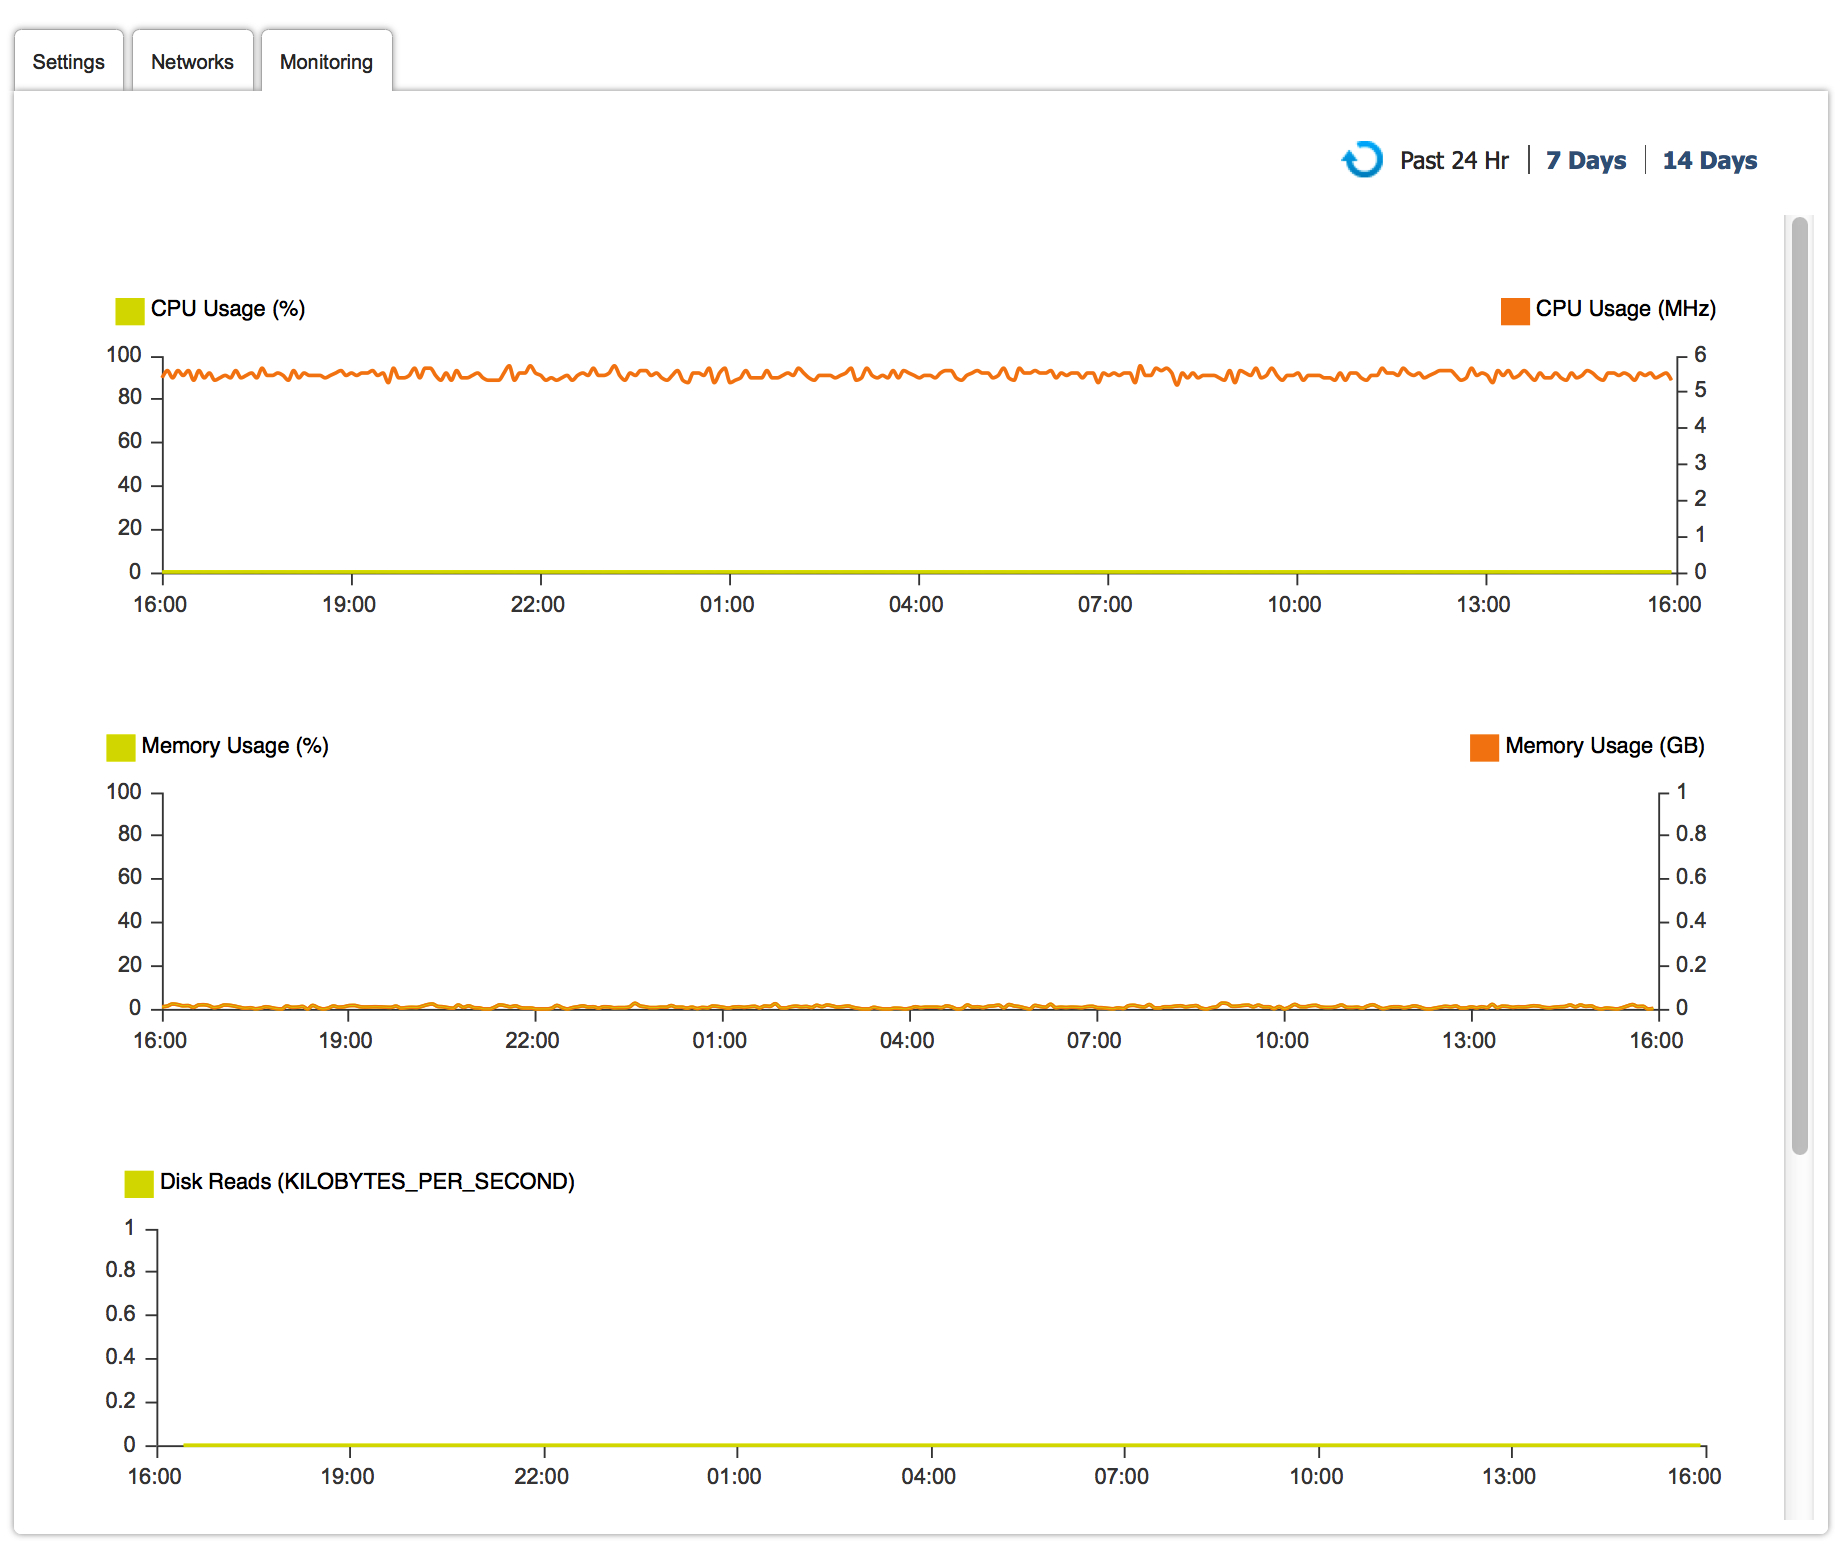
In vCHS we did solve #A with the VM monitoring features we introduced a few months ago. This is available both as an API as well as a UI interface:
However, we haven't yet solved #B. As a matter of fact this data point in the picture below only tells you how much capacity you are reserving in a virtual data center (not how much capacity all your VMs are actually consuming). This is a common misunderstanding among vCloud Director customers. These are the (occupied) seats on the bus if you remember the analogy:
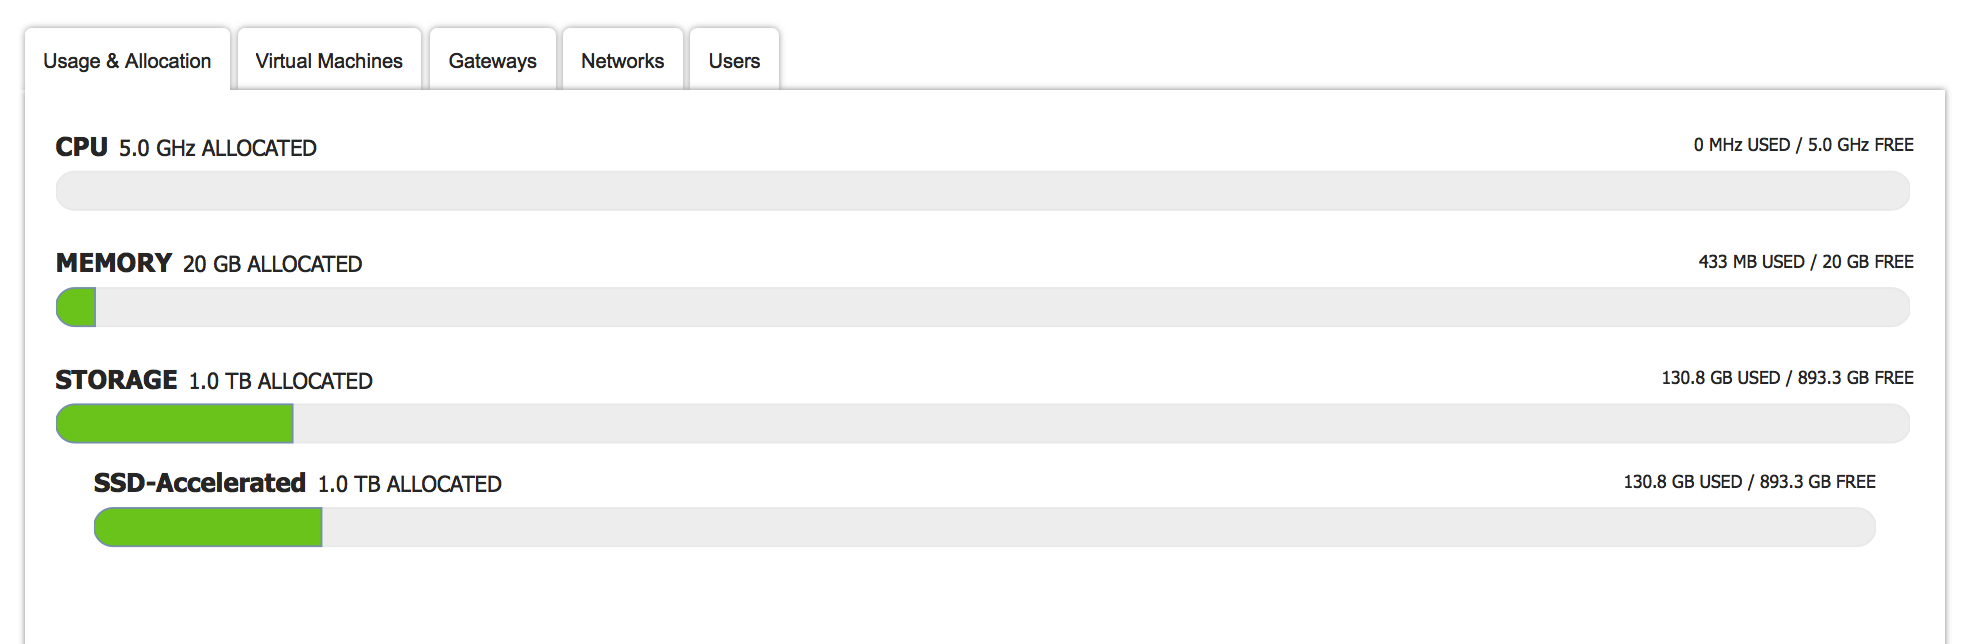
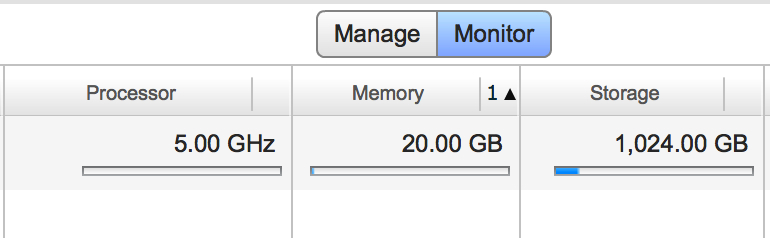
And this is just a different view, in the vCD UI, of the same data point. The interface above is just built consuming the proper vCloud APIs.
Also, we have only partially solved problem #C.
Now vCHS provides VM level actual usage with historical data points (again via both API as well as a UI interface - note the picture above has 24 hours, 7 days and 14 days views).
However we do not provide the same historical and trending data points for reservations (only point in time).
As far as actual virtual data center consumption we show nothing (be it point in time or historical).
The Solution
Enter vDCMonitoring.
In an effort to exercise my (non-existent) programming skills, I have created this "small suite" of programs to implement what I thought was missing in vCHS. This was done purely as a learning exercise (VMware may come out with a similar out of the box set of features any moment, which would be awesome).
Since I think we have enough information related to VMs, I focused my attention on how to properly monitor and do capacity management at the virtual data center level.
In an attempt to do so. I wrote two small programs.
One is a Ruby script that you can use to query your virtual data centers and get all of the above information. Since I wanted to know the historical trends of my virtual data center resource consumption, I run the tool with an infinite loop (you can customize the poll interval at run-time) and I save the data points in a CSV file (whose name is also customizable at run-time).
You can then use the CSV file with the visualization tool of your choice (e.g. Excel) or you can use the second program that I wrote: this is a simple HTML5/JS site that you can use to load the CSV file and visualize the historical usage of your virtual data center.
The whole package with the two programs is available on Github (the ruby script is in the "CSV Creator" folder and there are CSV samples in the, guess what, "CSV samples" folder).
Note that the HTML5/JS program is also currently available online on the Pivotal Cloudfoundry instance at this link: http://vdcmonitoring.cfapps.io/
This is part of some CF experiments I am doing and it may very well be that I will need to tear it down at some point. You can still get it from Github and run it off your laptop if you want with your browser of choice.
This is the very high level flow of how vDCMonitoring works:
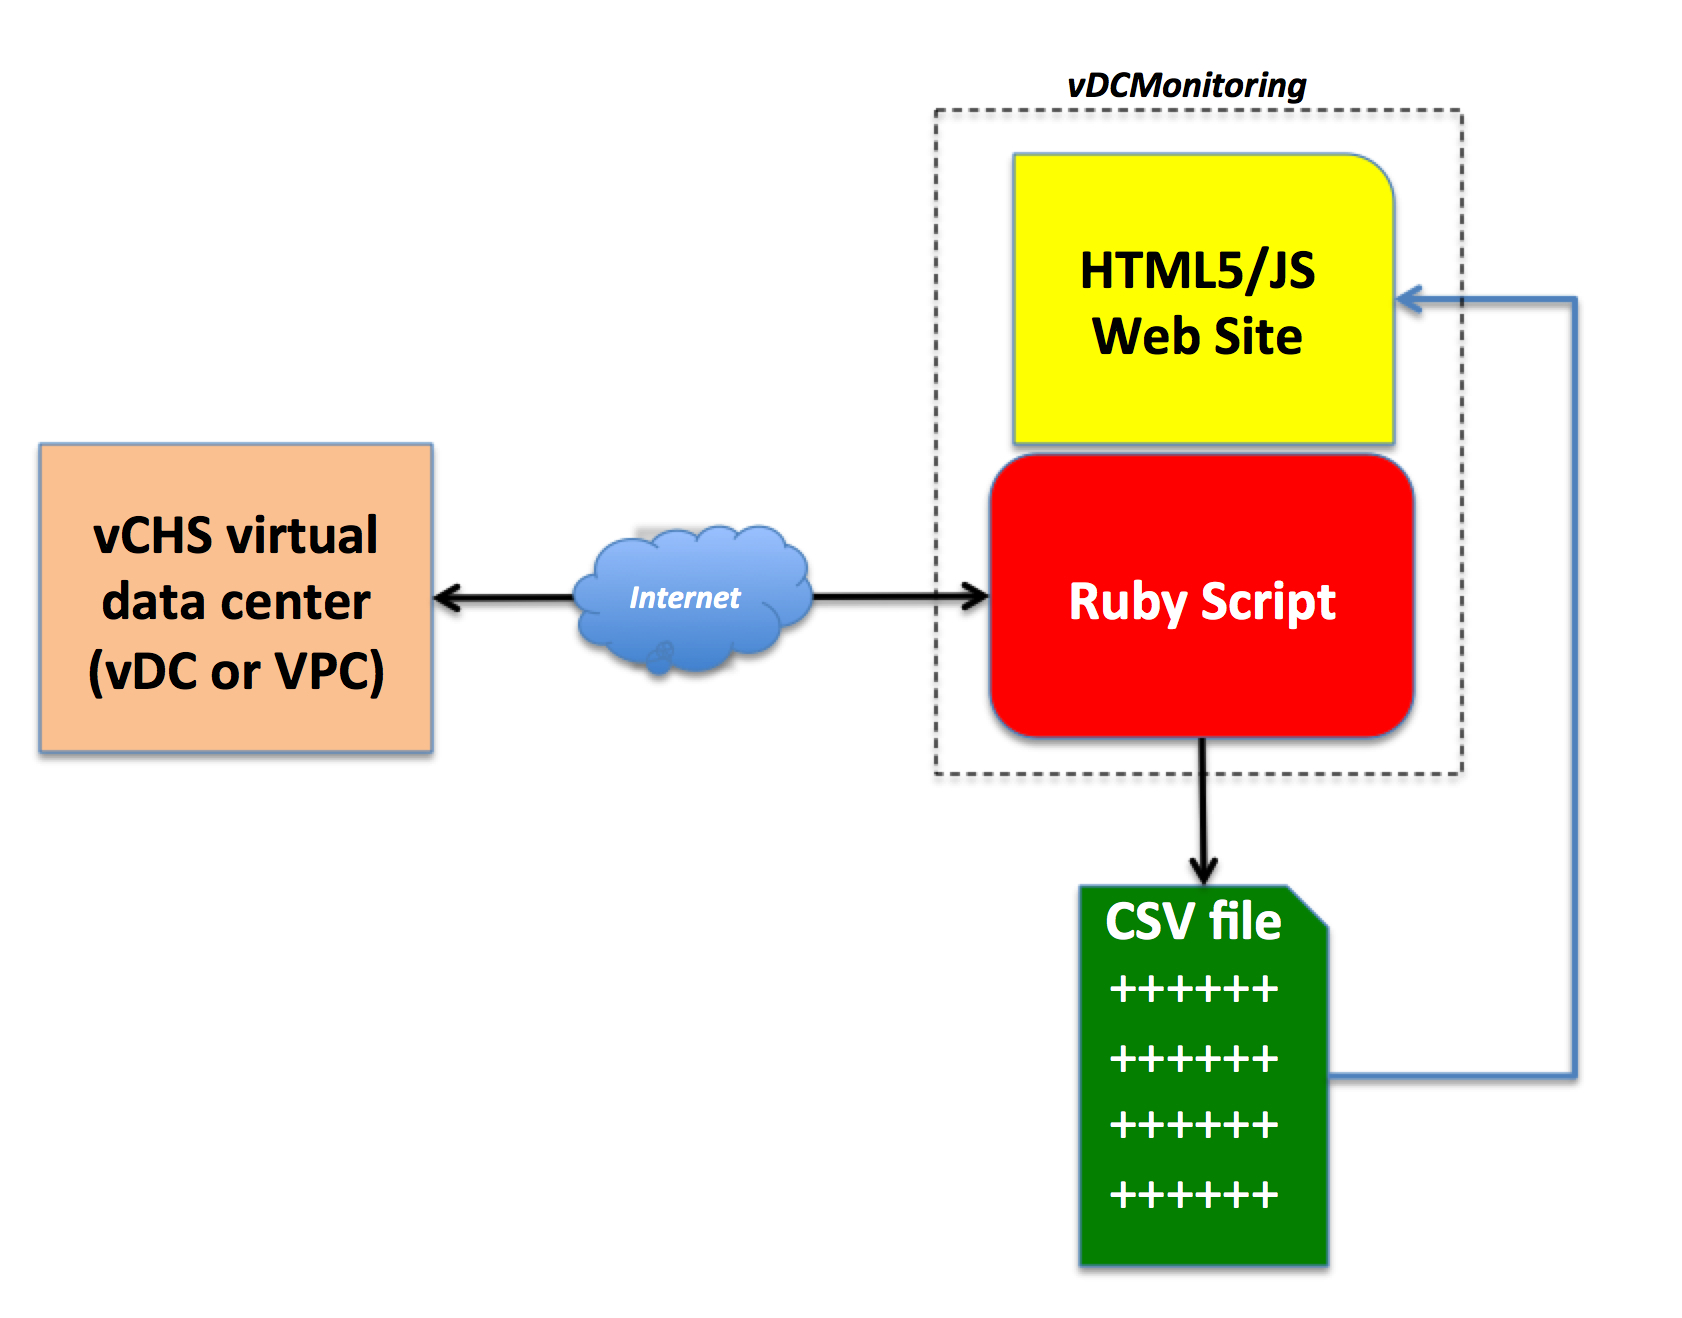
I tried to comment the Ruby script as much as possible so that you can see what happens if you read the code but the overall principles are as follows:
-
since I need to get allocated size and reservation size data points for virtual data center metrics at every ruby script cycle (vCD doesn't have historic values for those data points) I also get the current metrics for VMs consumption as well (despite the fact that the VM metrics do provide historic values).
-
at every poll I iterate through all VMs and get actual consumption metrics for both CPU and Memory and I sum all them up. This gives me how much a virtual data center is actually being consumed (not just reserved).
-
note that each VM call takes about 4 or 5 seconds to complete. That means that, if you have a large number of VMs, the data point at every poll isn't really at the same timestamp (because the VM queries are serial and not parallel)
-
because of the above, the best usage of this tool is for capturing long term virtual data center usage trends with a high polling interval (e.g. 5 minutes or 10 minutes). This tool isn't really ideal to do real-time consumption analysis.
Onto some examples now.
vDC (dedicated cloud) monitoring and capacity management
I ran the Ruby script against a vDC on a dedicated cloud to demonstrate two things.
The first thing is that the relationship between actual resource usage and resource reservations is decoupled: you can have VMs with no reservations that are working very hard consuming lots of resources and VMs with 100% reservations that are doing nothing. This is what the following example is all about:
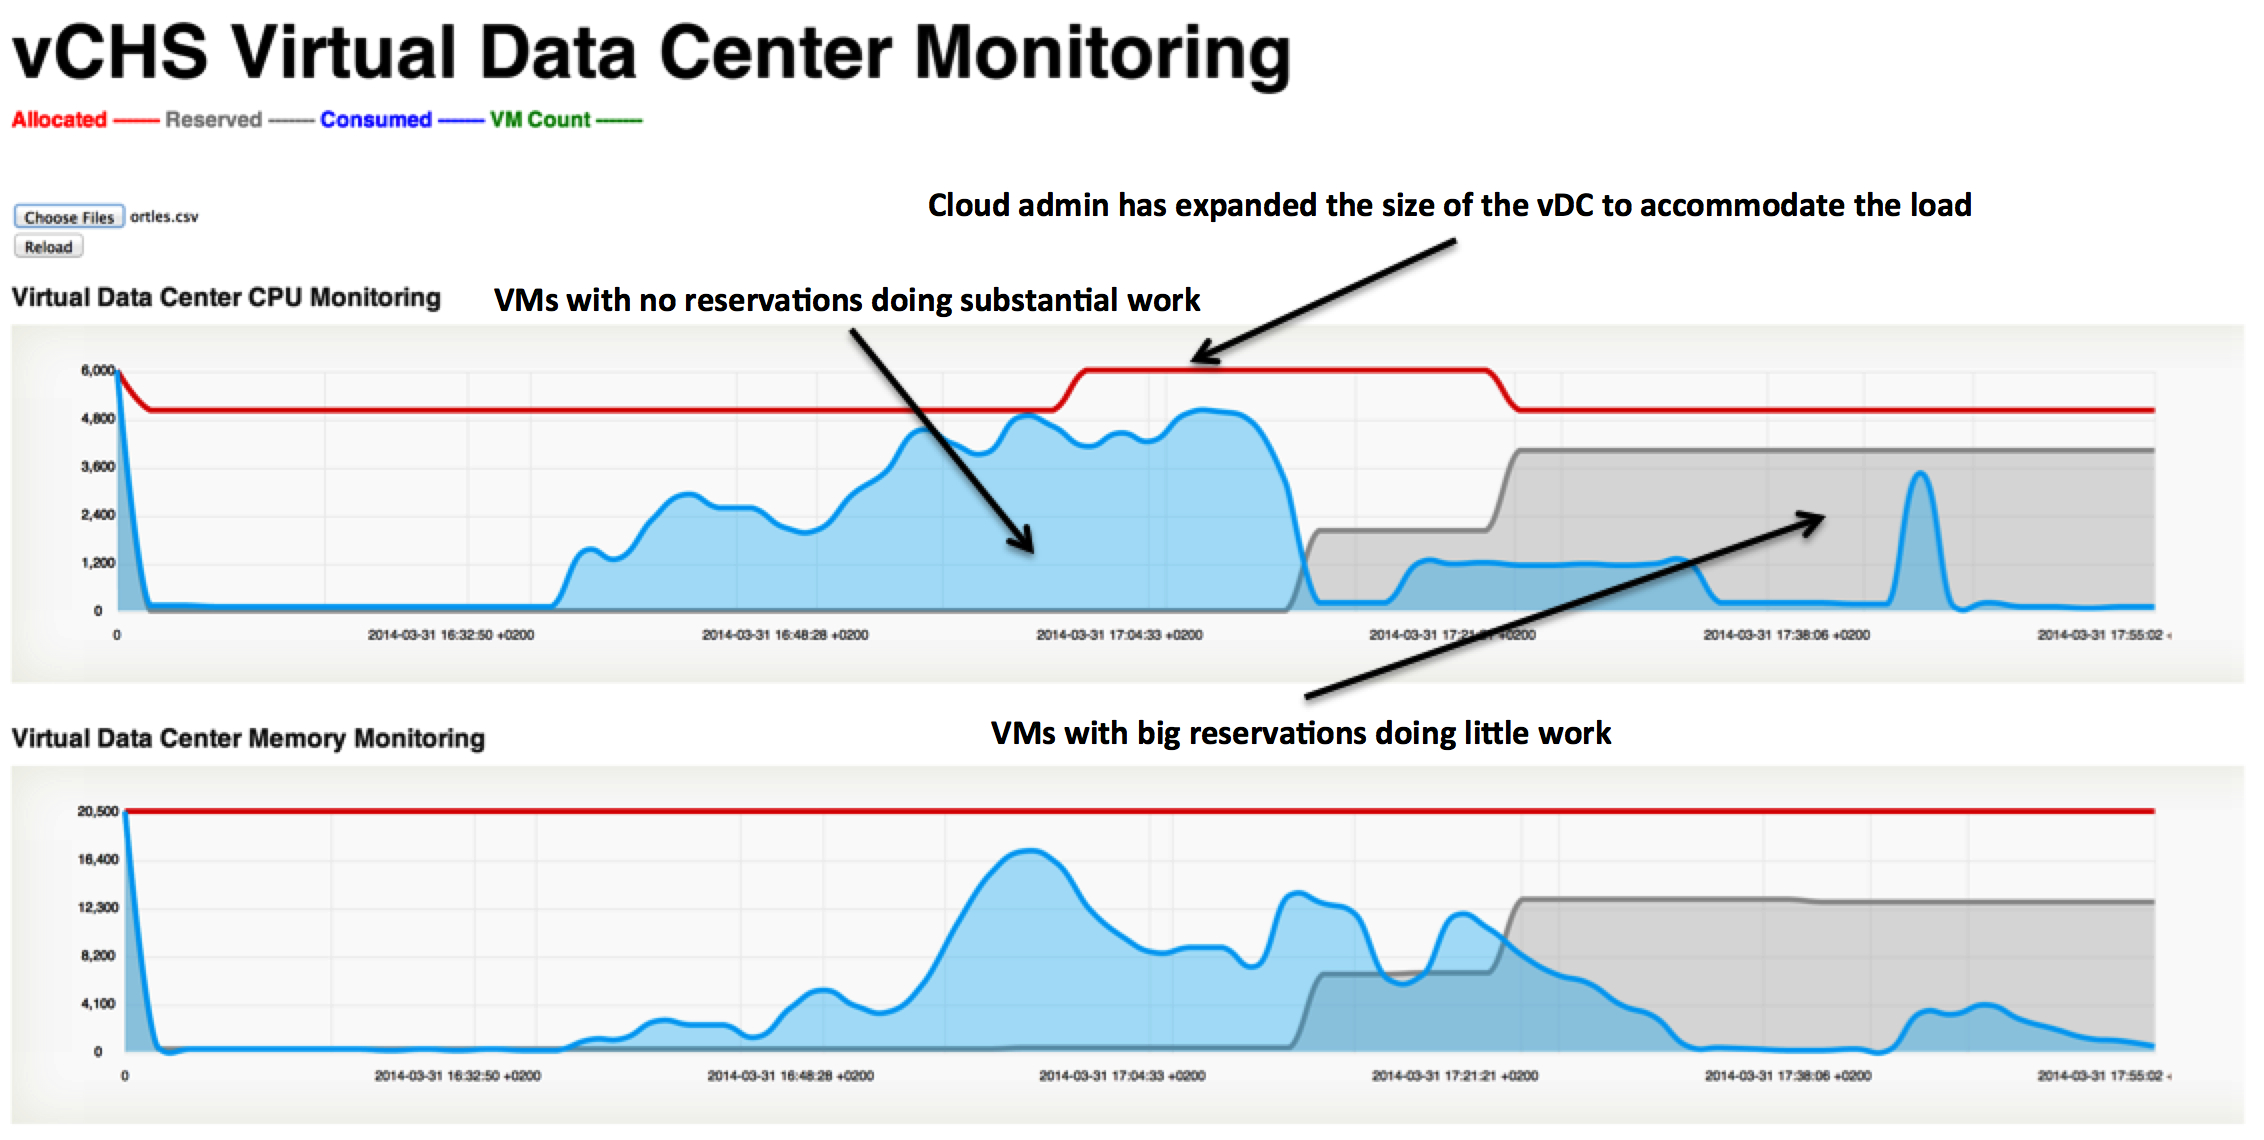
As you can see above there is a lot of flexibility and fine tuning you can do. That's the bus with no seats where you can choose the interiors you want.
In this example above I am initially reserving nothing and then I decide to reserve quite a bit of capacity for a few VMs that are actually doing little (see right hand side of the chart). But they are important and I want them to find the resources they need when they need them. Essentially I gave them a few business class seats.
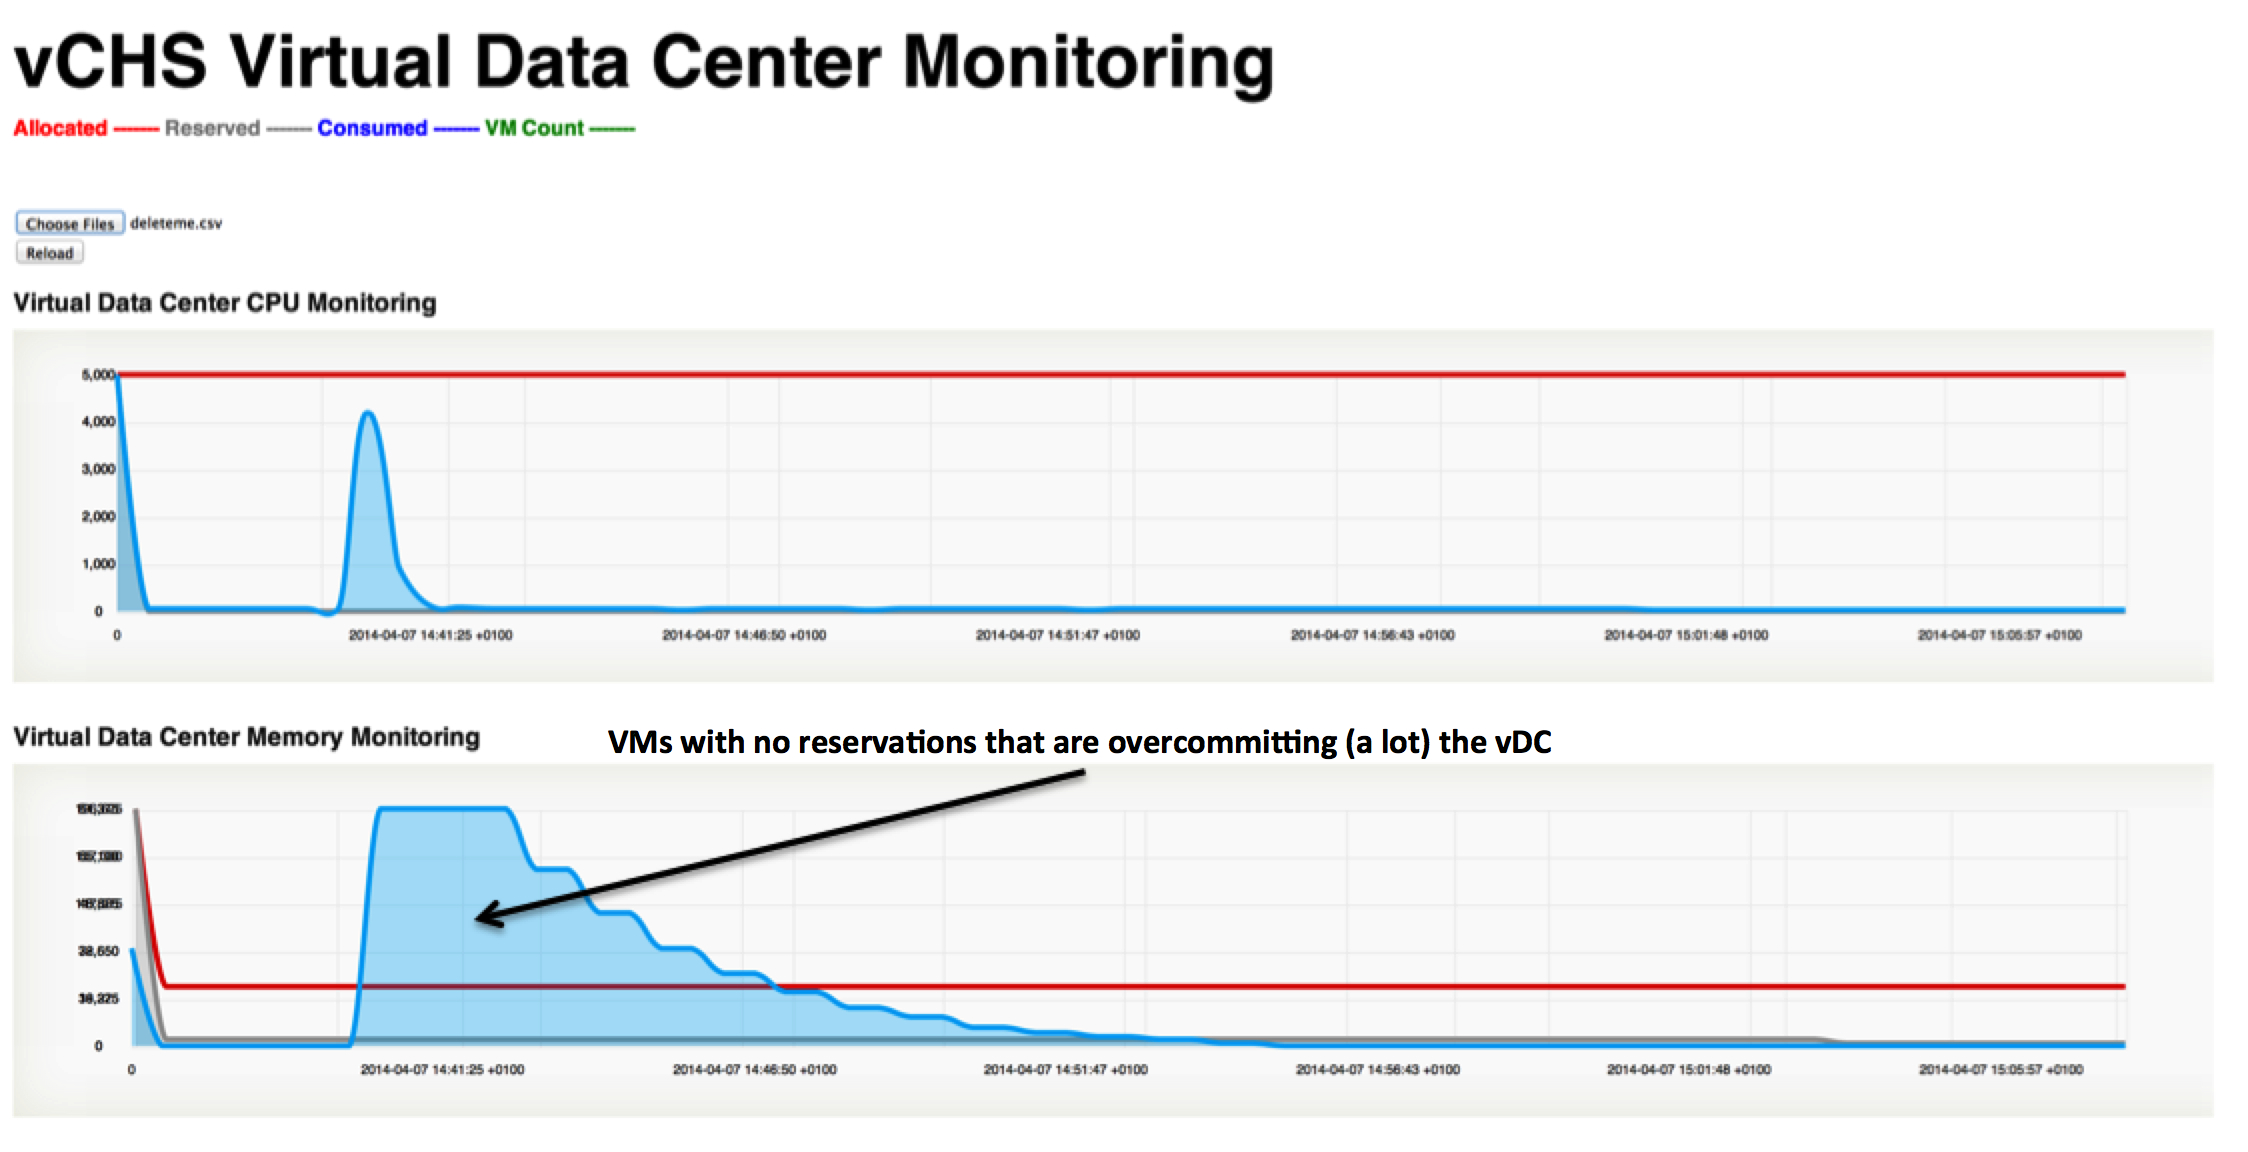
The second thing I want to demonstrate in the context of a vDC on a dedicated cloud is the idea of overcommittng resources.
In the example below I have removed all reservations from the VMs and I have powered up VMs whose aggregate memory configuration goes well beyond the 20GB I have allocated in my vDC. I essentially decided that this bus should carry some 300 people and comfort isn't a priority.
This is absolutely great for test and development environments where you don't care about performance but you care about "how many VMs" you can stuff into your vDC. In a way you could create many small super-ultra-micro instances if you want to.
VPC (shared cloud) monitoring and capacity management
VPCs behave in a very completely different manner. You don't have all those knobs you can tweak. You are on autopilot.
As a matter of fact this is what happens when you start using a VPC:
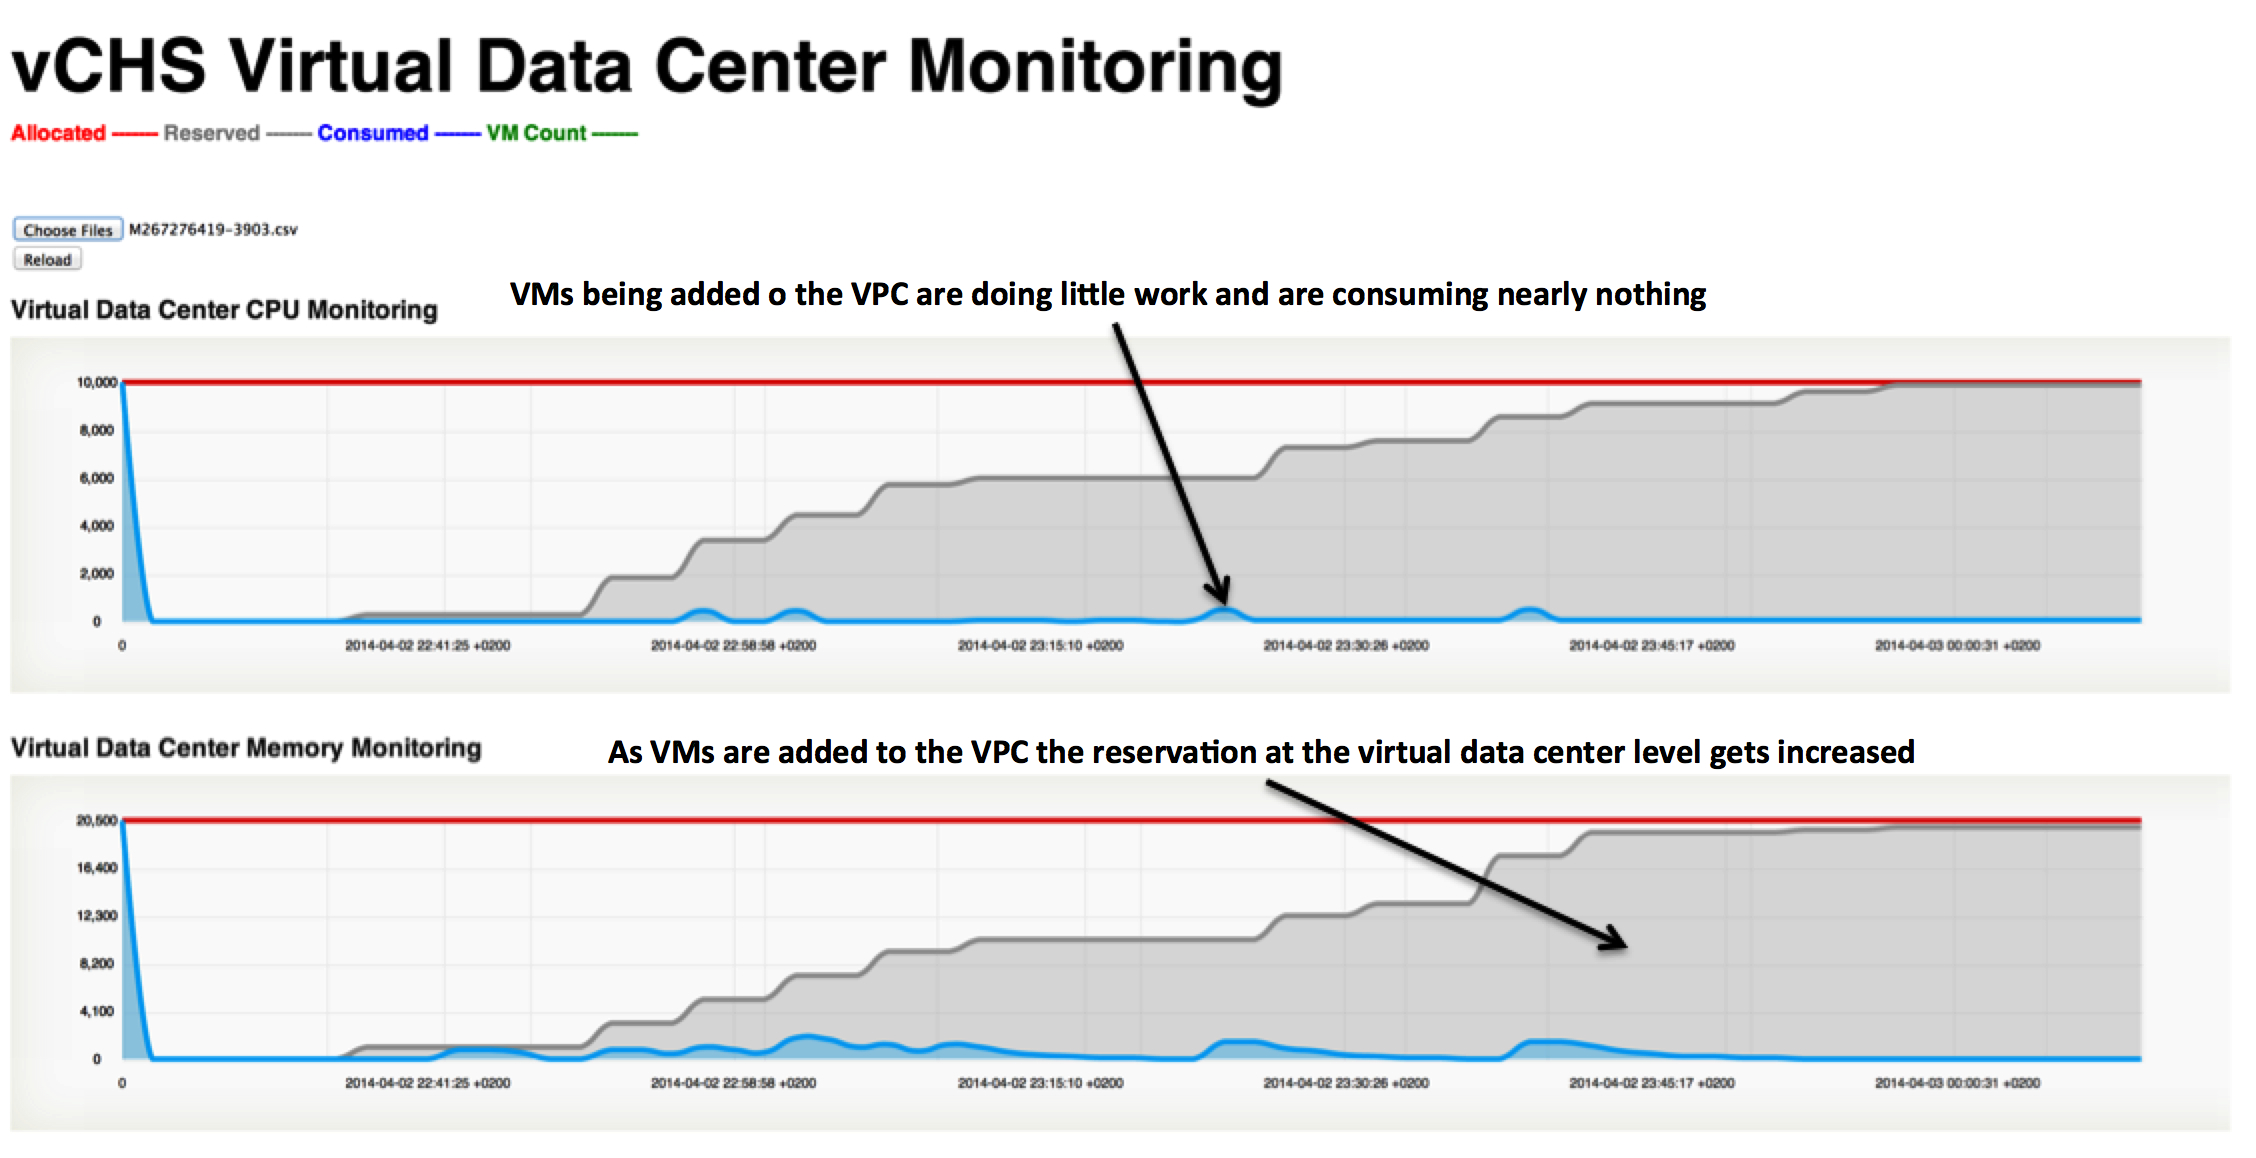
In the example above, I have started to power on regular VMs in a VPC. Because of the pre-defined reservation rules that are in place in the backend, as you add VMs the system will add a reservation to the VPC (both for CPU and memory). As you approach the limit of either one or the other subsystem in your VPC, trying to power on an additional VM will result in a black eye:

This is regardless of how much actual resources the other VMs are using. As you can see in the chart, in fact, those VMs are doing quasi nothing.
This is the bus with 55 regular seats. As the 56th person tries to get on the bus they will get a "I am sorry, you can't get on the bus, it's full". This is regardless of whether the 55 people already on the bus are sleeping or screaming.
Conclusions
As you could depict from the charts the idea is that a VPC is a good fit for customers that do not want or do not need a lot of knobs. They want the cloud provider (VMware in this case) to provide guard rails in terms of resource allocation policies without having to tweak parameters or having to deal with advanced controls. They want to be able to add VMs until "it makes sense". Since they don't have that "sense", they want VMware to figure it out for them.
On the other hand the vDC (on a dedicated cloud) is more suited for those customers that have particular needs. These customers want to be in control of the resource allocations and want to tweak them based on the use cases they have (e.g., SAP, test and development, etc).
Note that this is a 101 introduction to a very complex topic. There are a lot of details I am hiding here for the sake of making it digestible for the masses.
I also hope that a tool like this can help educate on these concepts (more than it could help to actually monitor a production vCHS tenant).
Now for the credits:
Andrea Siviero, because he helped me with the HTML/JS hammering and, in doing so, he has demonstrated to have once again above-average patient.
William Lam, because my ruby script hasn't been written from scratch and we all stand on the shoulders of giants.
Massimo.